Medical record retrieval is a crucial component of any risk adjustment or HEDIS® project, yet it is perhaps one of the most difficult. Retrieval is labor intensive, consumes time and resources, and requires great patience and persistence.
Medical record retrieval is a crucial component of any risk adjustment or HEDIS® project, yet it is perhaps one of the most difficult. Retrieval is labor intensive, consumes time and resources, and requires great patience and persistence.
Is there a way for health plans to increase their retrieval success rate without simply throwing more money at the problem? How can they ensure they’re getting the best return on investment (ROI) in their retrieval initiatives? The key is to analyze provider behavior patterns and re-direct resources to where they can be the most productive. Certain metrics, when analyzed in combination, can reveal where your retrieval approach may need refinement.
The Key Metrics
Retrieval success rate by provider site is the first metric. Every health plan has a target retrieval rate to hit, generally somewhere in the area of 85 to 90 percent. As an example, when we analyze our database of information on 1.7 million providers, we can clearly see that there’s a small percentage of providers who will rarely submit the requested charts (see Figure 1). In this case, rather than waste time making a second or third call to these providers, a retrieval agent’s time is better spent making a fourth or fifth phone call to a provider’s office with a high likelihood of chart delivery.
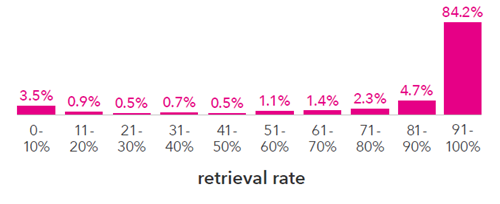
Figure 1. Retrieval success rate by provider site
Another key metric is retrieval rate by number of contacts (required to retrieve a record). A retrieval agent only has so many hours in a day, and every call to a provider’s office chews away at the clock and your ROI. Figure 2 shows that more than three-quarters of all records retrieved are from provider sites that require 10 or fewer contacts. Agents also have success retrieving records from providers requiring 11 to 20 phone calls—even 21 to 30. By the law of diminishing returns, however, the reward is simply not worth the effort of going after those highest-contact providers.
|
# of contacts |
1-10 |
11-20 |
21-30 |
31-40 |
41-50 |
50+ |
|
requests retrieved |
75.2% |
17.1% |
4.7% |
1.5% |
0.7% |
0.7% |
Figure 2. Percentage of records retrieved by number of contacts required
Another critical factor to consider is the fees charged by the provider site. If a chart will only bring in $30 in incremental revenue to your plan and the site charges a retrieval fee of $25, the value of that chart isn’t really what it seems. This is where historical data is particularly valuable, as you can tell which providers are likely to charge excessive fees before you put in the effort of retrieving a record. An analysis of more than 1 million provider sites shows that average retrieval rates drop sharply to 50 percent and lower among sites that charge an excessive fee at least 25 percent of the time (see Figure 3). Taking into account all other metrics, health plans may want to avoid those sites where possible.
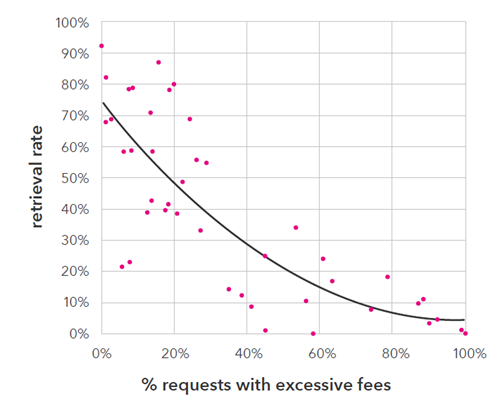
Figure 3. Retrieval success rate compared to requests with excessive fees
The last metric is retrieval rate by contact method. As chart retrieval experts, we keep detailed records about how each provider prefers to be contacted about a chart. We analyzed three different methods of chart fulfillment from provider sites once the initial phone call request was placed: mail, email, and fax. Each method was based on contract requirements or site preferences. Figure 4 shows a much greater retrieval success rate for requests sent via email or fax rather than traditional mail. In a scenario such as this, if a provider asks that the record request be mailed, plans should think twice about whether it’s worth the cost versus spending that time and money on a different request.

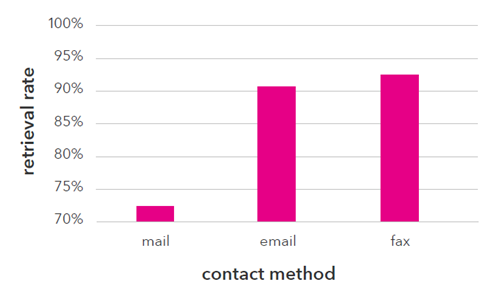
Figure 4. Retrieval success rate by contact method
Scoring A Record Request
Now that we’ve examined some of the key metrics that should inform a health plan’s chart chasing efforts, how do we look at them holistically? Figure 5 shows a scorecard incorporating all the metrics we discussed. While it may take an average of 10 contacts with the provider site to retrieve Record 1, the likelihood of success appears far better than that of Record 2 when the other key metrics are considered.
|
|
Site retrieval rate |
Contact method |
Excessive fee rate |
Average # of contacts |
Likelihood of success |
|
Record 1 |
89% |
Fax |
0% |
10 |
92.1% |
|
Record 2 |
82% |
|
5% |
5 |
70.5% |
Figure 5. Record request scorecard.
When retrieving records for the purpose of risk adjustment, another important factor may influence a health plan’s approach: the incremental value in revenue that a chart will bring to the health plan once it’s retrieved. In the example above, if Record 2 will generate $200 and Record 1 will generate $100, the plan might conclude that the potential excess value outweighs the lower likelihood of successful retrieval. See our infographic on chart mix and other variables that can impact a health plan’s risk adjustment bottom line.
Bringing It All Together
We’ve looked at four key metrics that go into retrieval rate success, which is the primary way a retrieval project is measured. These different factors, in addition to many others, all play an important role, and neglecting any one of them will hurt the success of the project overall. Whether you’re retrieving records in house or working with a partner such as Verscend, using analytics to inform your strategy is the only way to success.
About The Author
Jake Wirth is a Senior Analytic Scientist in Verscend’s Payment Accuracy and Risk Adjustment business areas. He works closely with data management and product management teams, providing analytic support to improve customer savings. Jake holds a BA in Political Science from Brigham Young University and an MS in Analytics from the Institute for Advanced Analytics at North Carolina State University.